At GrapheneDB, there are different mechanisms that we provide to add visibility into how your deployment is doing. Please find them listed below:
Overview of my database
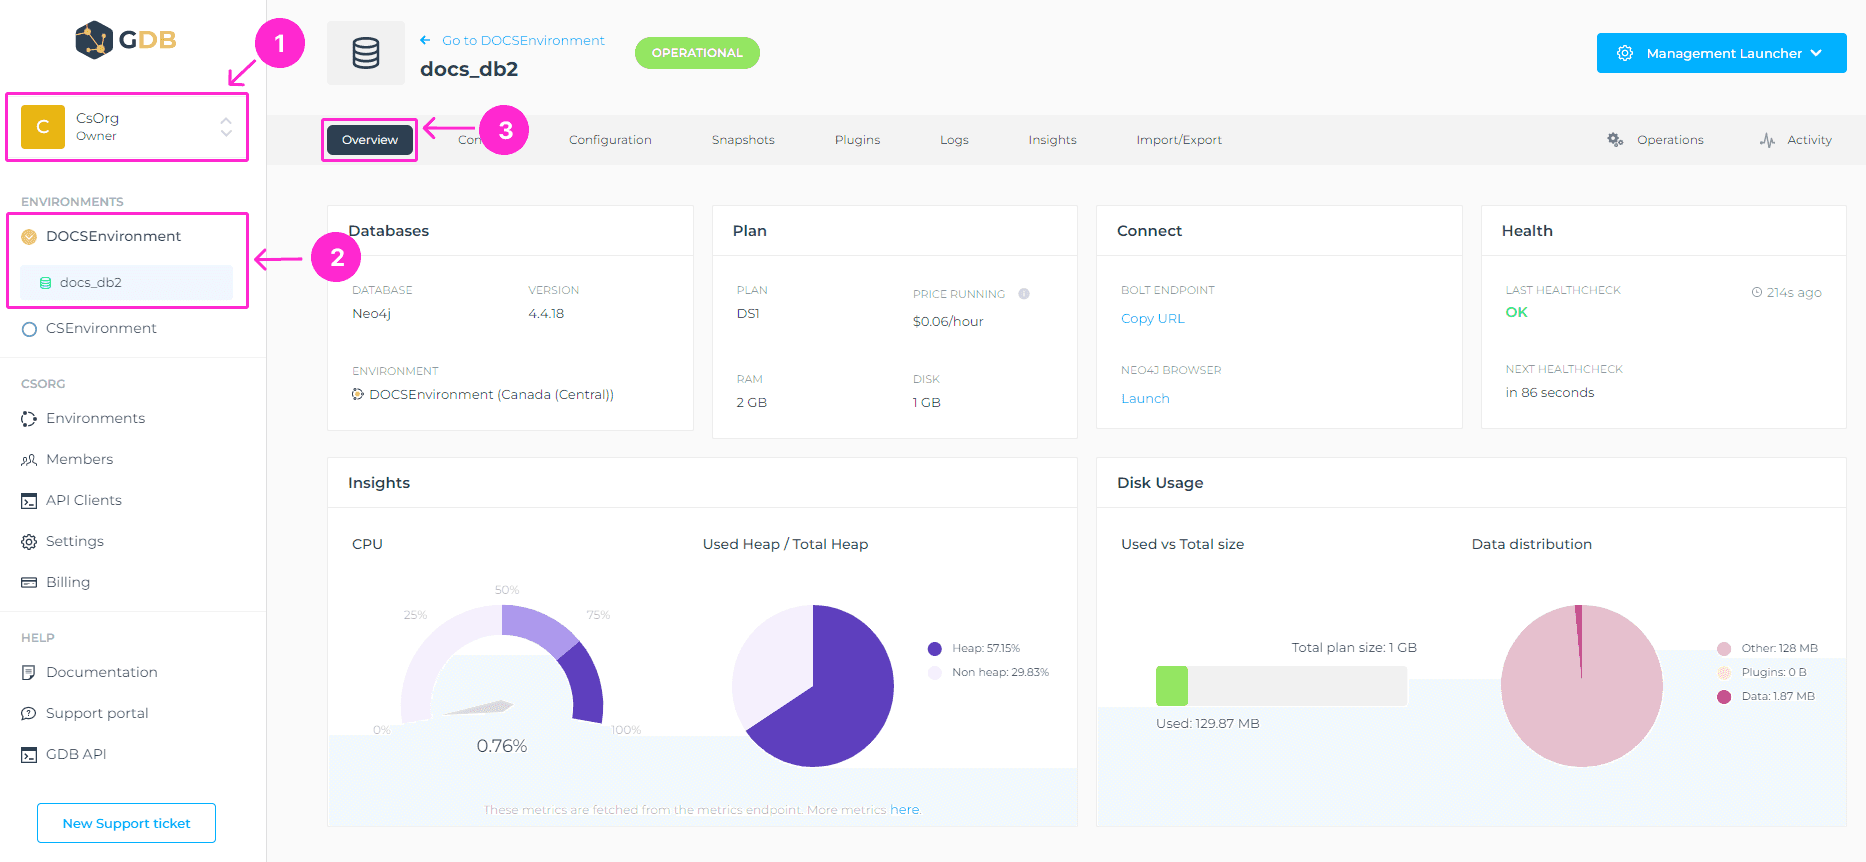
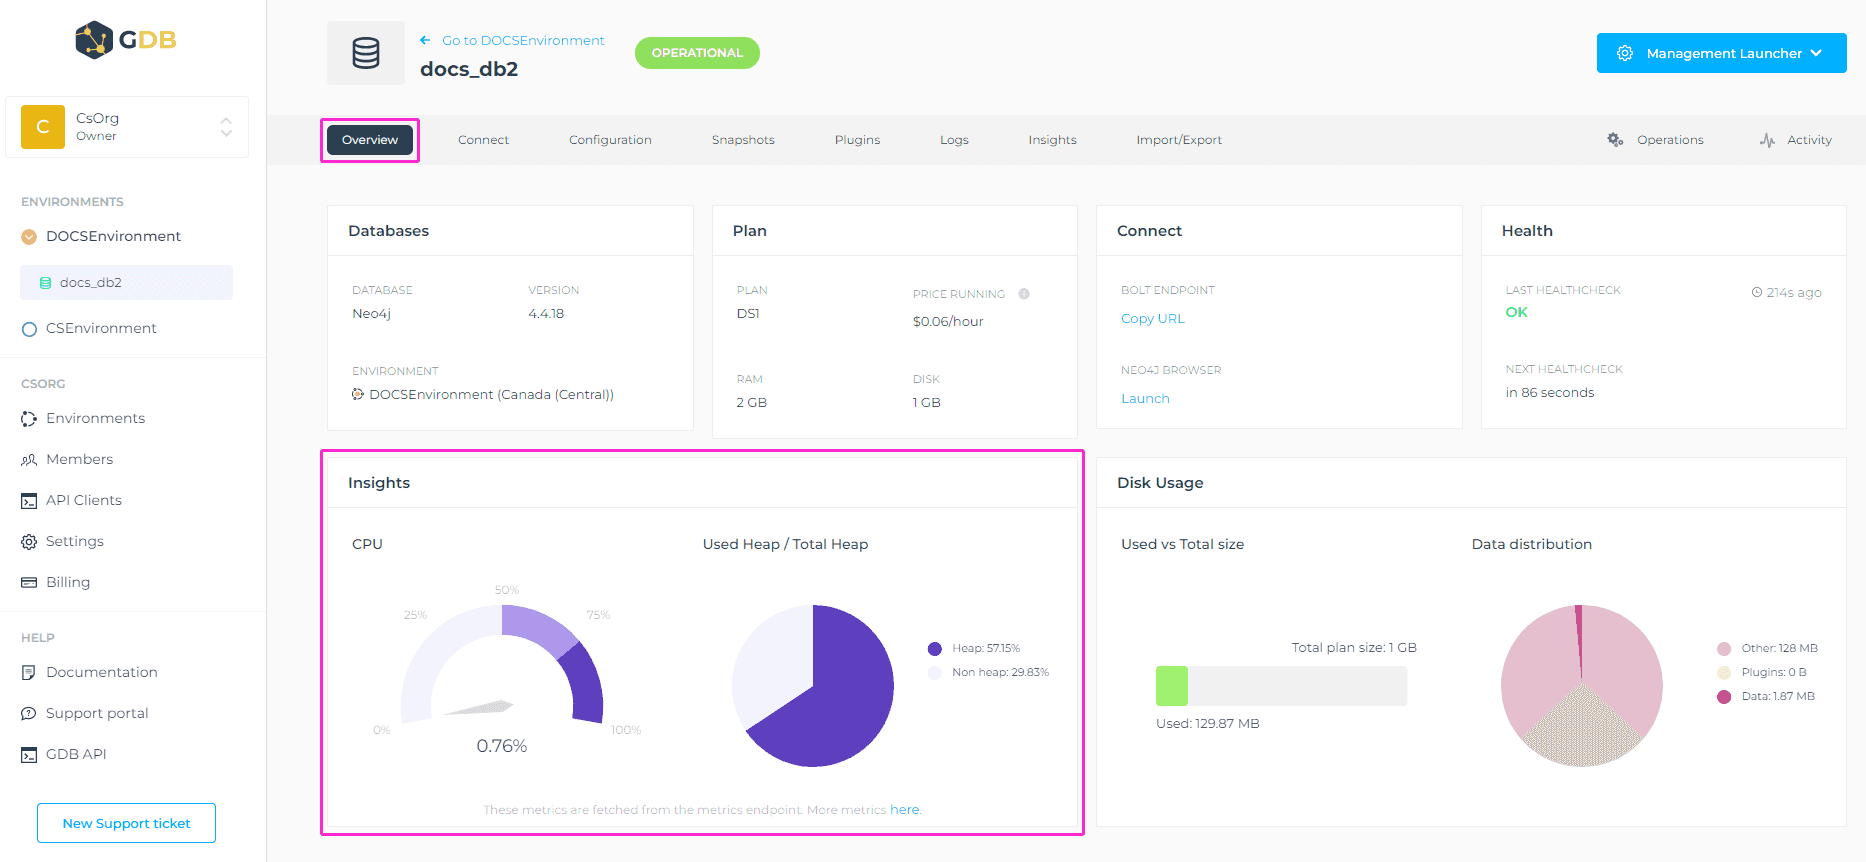
In the database Overview tab, GrapheneDB provides you with a way to have a clear rundown of the overall information related to the selected database. This information includes the health status of your database, insights into the CPU load, Heap used, as well as disk usage info (total size and data distribution). Keep in mind that the server metrics in the Overview are the last metrics that were fetched. For more metrics, history, etc. please go to Insights tab.
To access this view please select the Organization > Environment where the database is placed > select the desired database > Overview tab.
Health Checks
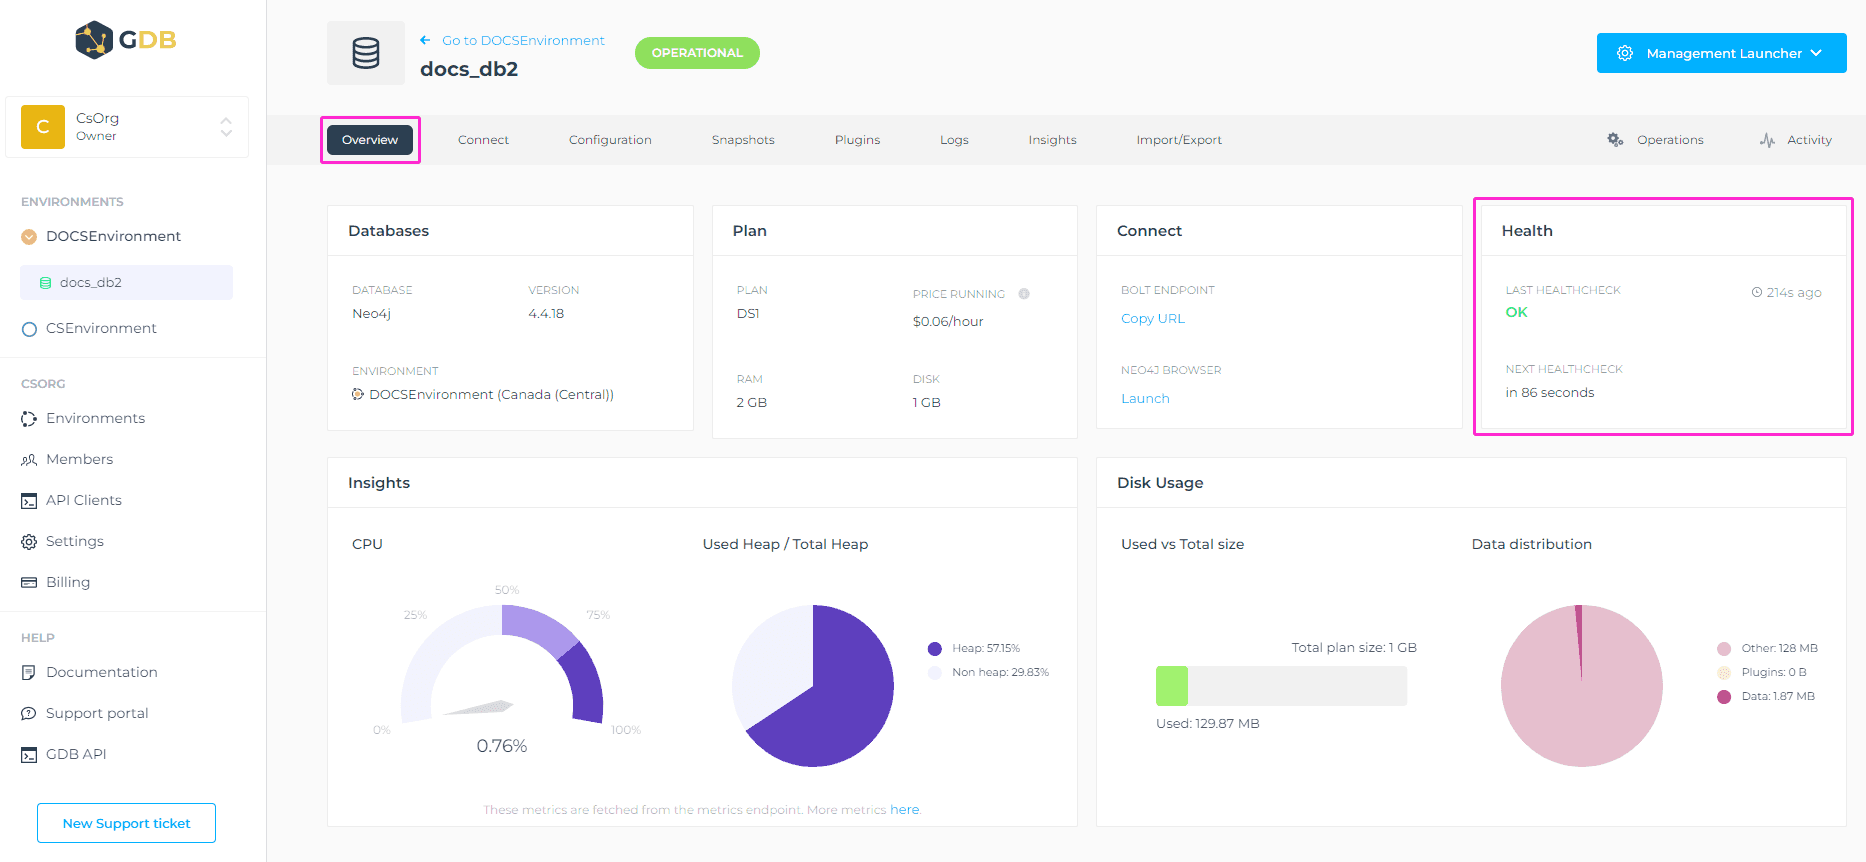
The Health section shows the current health state of your database, when was it last checked, and when it will be checked again. The status can be OK or Impaired. If it is Impaired, you can look into server metrics, view the last operation and go into the Logs to check for any obvious errors or warnings.
ℹ️ Info
Health checks are performed every 5 minutes.
To access this info, navigate to Overview tab > Health.
Disk Usage
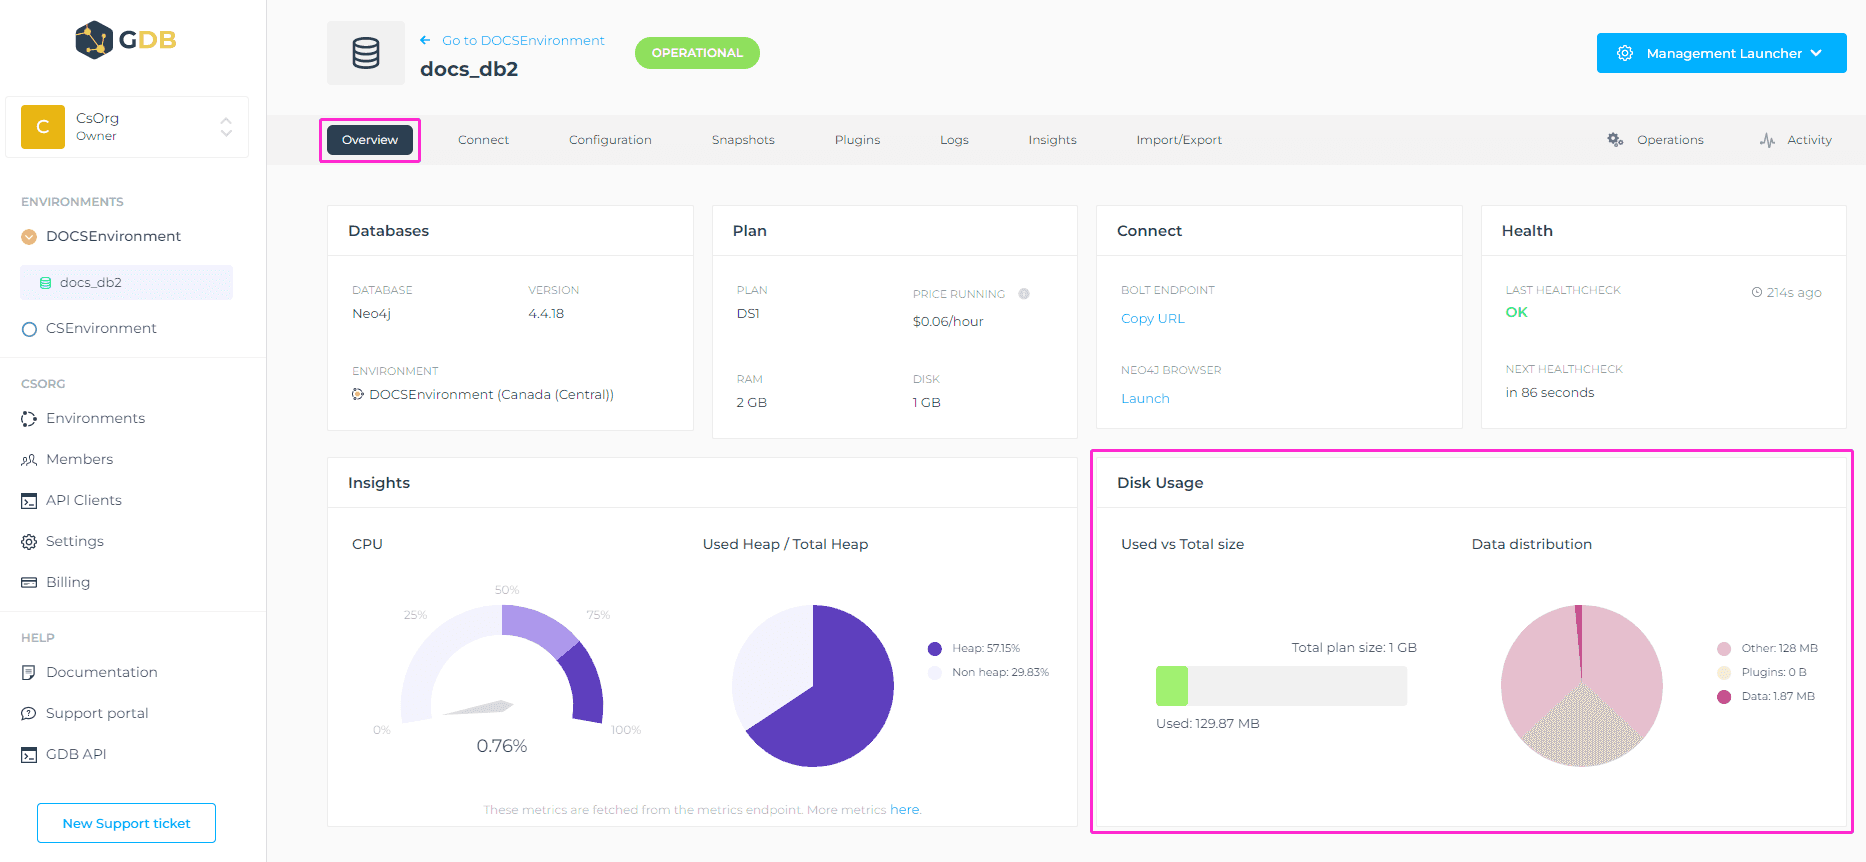
The Disk Usage section gives you a view into the total size of the disk vs the used space, and also into the size of Data distribution on the disk. For example, if you have some Plugins installed, you’ll be able to know how much space it takes besides the data written on the disc.
To access this view, please go to Overview > Disk Usage section.
Why disk usage is important to have in mind?
- Ideally dataset fits into the page cache. More info on the page cache in this article.
- What happens if you get to 100%? When a database exceeds its plan limits for disk storage the database logs will show
no space left on device. The quickest solution for this situation would be that you upgrade the database plan. Alternatively, you can reach out to our support team by opening a Support Case, and we can do the operation of reclaiming disk space, if there is disk space to reclaim from previously deleted data. Keep in mind that this requires downtime.
Insights
In the Insights section, you can see the current usage percentage of your database’s CPU, as well as the Total and Used Heap. Heap memory is the runtime data area from which memory for all class instances and arrays are allocated. The heap can be configured, please check this article for more info.
There’s also a more detailed view of the Insights (Insights tab) where we provide you with visibility into the deployment and underlying server. The metrics that you have visibility into are health checks and out of memory errors, CPU usage, Memory usage, Network, and Disk I/O.
Please navigate to the Organization > Environment where the specific database is placed, and click on the database you want to look into the metrics for > Insights tab.
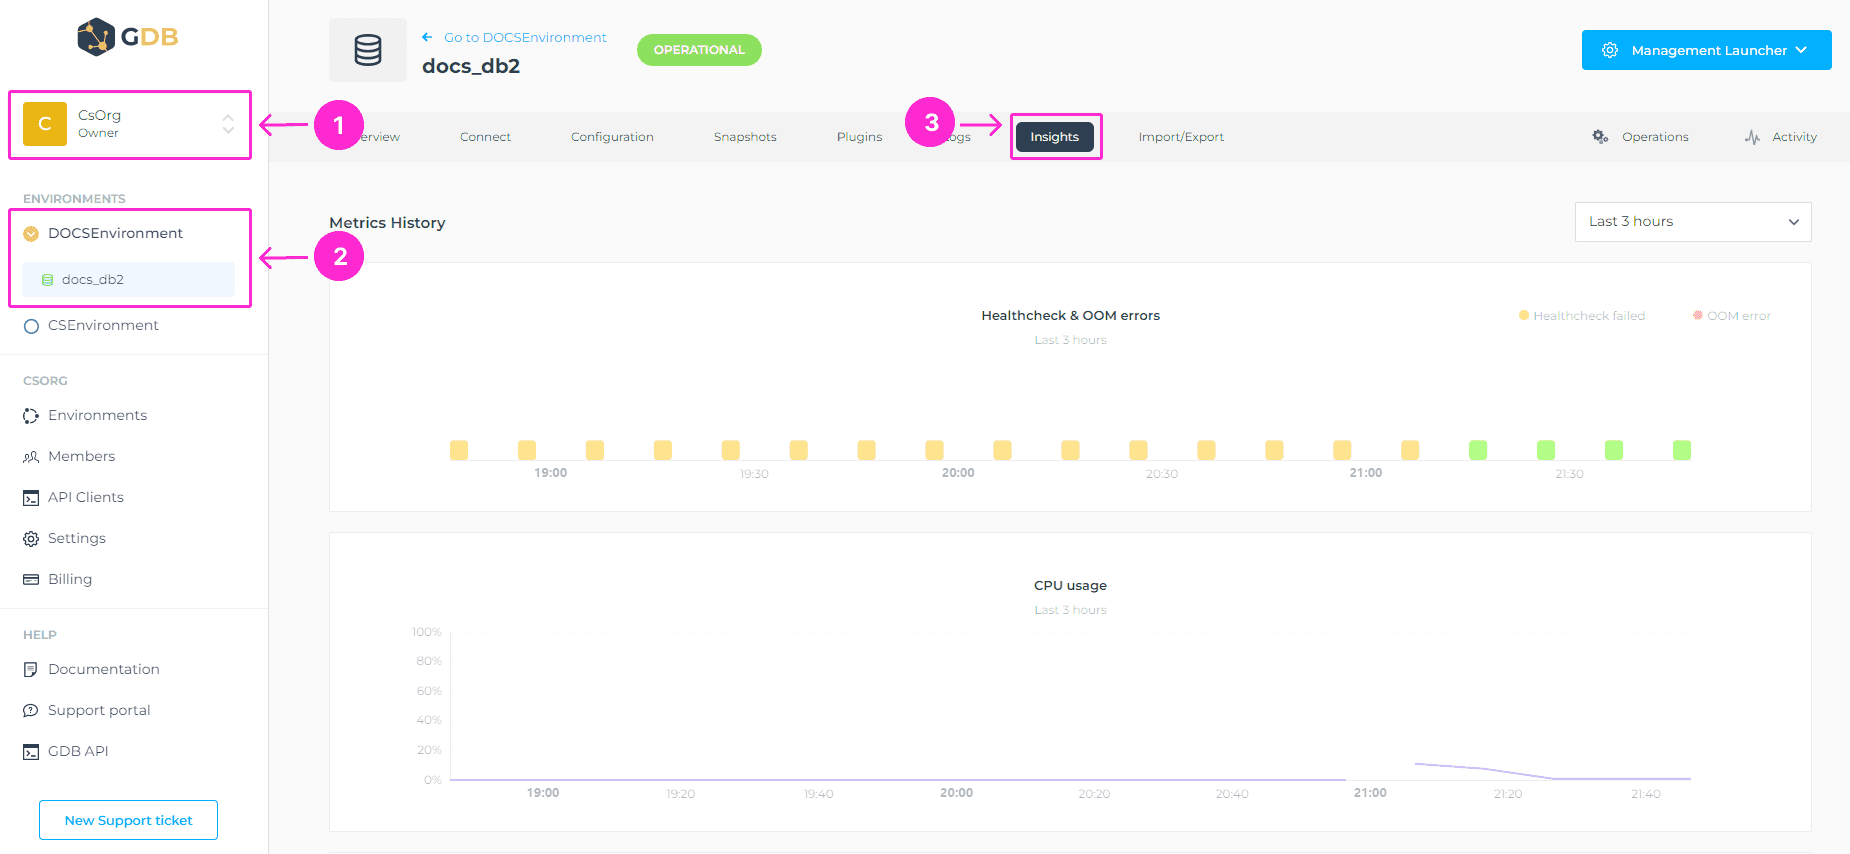
For more details on what info each of the metrics gives, and what options you have when it comes to selecting the time frame, please see this article.
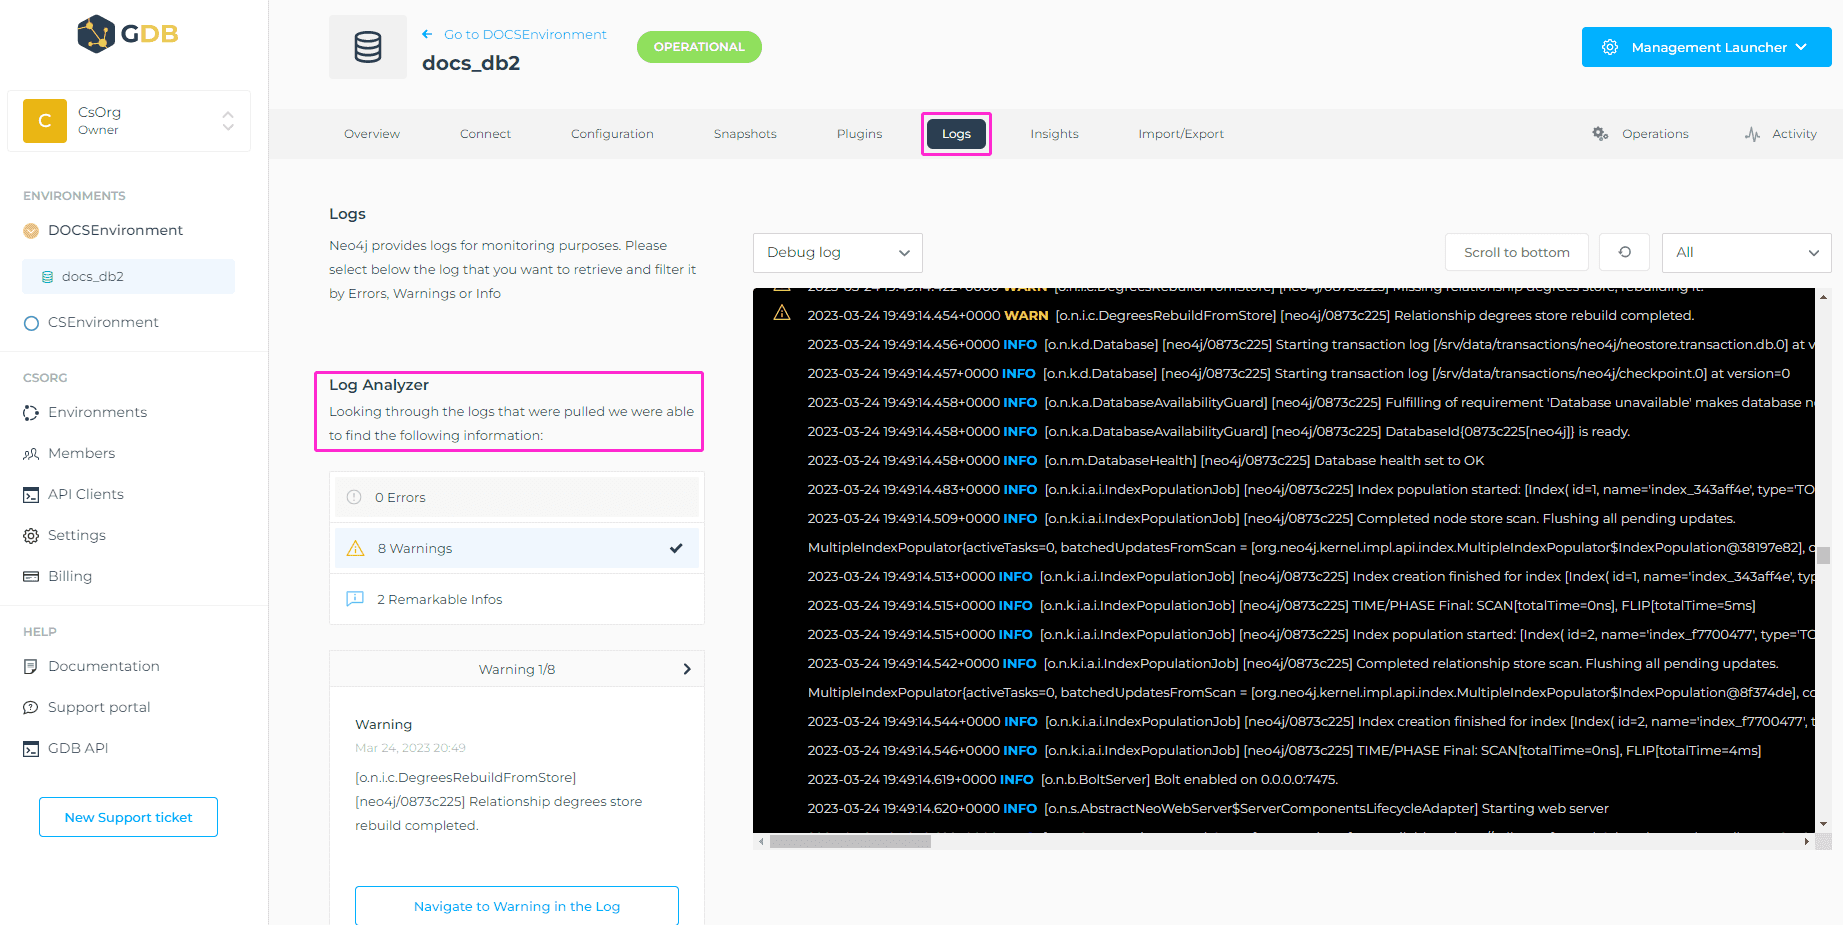
Logs
In your database Logs tab, GrapheneDB shows the logs natively provided for monitoring purposes. Additionally, we added a Log Analyzer feature that helps you with debugging and quicker insights. Log Analyzer goes through the log that is loaded and extracts relevant information to map it to an explanation.
ℹ️ Info
If the database is in a Paused state, logs are not visible. You will need to Resume your database to see the log entries.
Please see the information below for which logs are available to you.
| Log Type | ----- |
|---|---|
| Debug log | The Neo4j debug log. It’s a log of information useful when debugging problems with Neo4j. |
| User log | The Neo4j user log, where general information about Neo4j is written. |
You can easily filter them by Warnings or Errors. Here’s a detailed info about this topic.
To access the logs, please navigate to the Logs tab of your database interface.