Visibility
We provide a great number of tools to gather information around your Databases and Organization. From historic metrics to log analyzers or activity feeds, you name it.
Historic Metrics
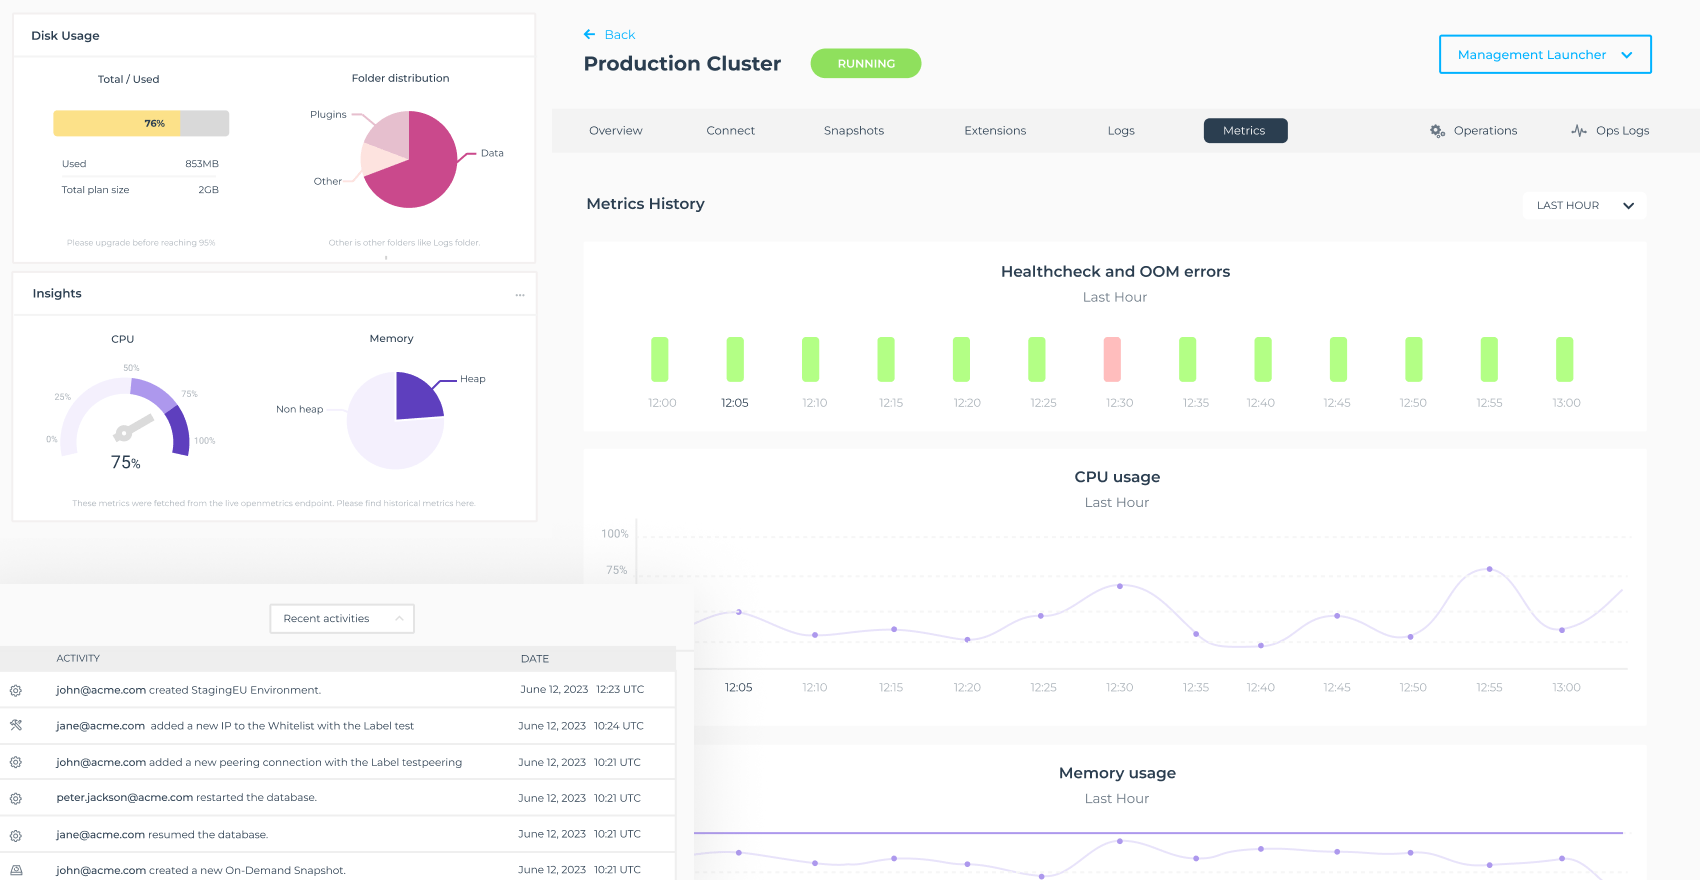
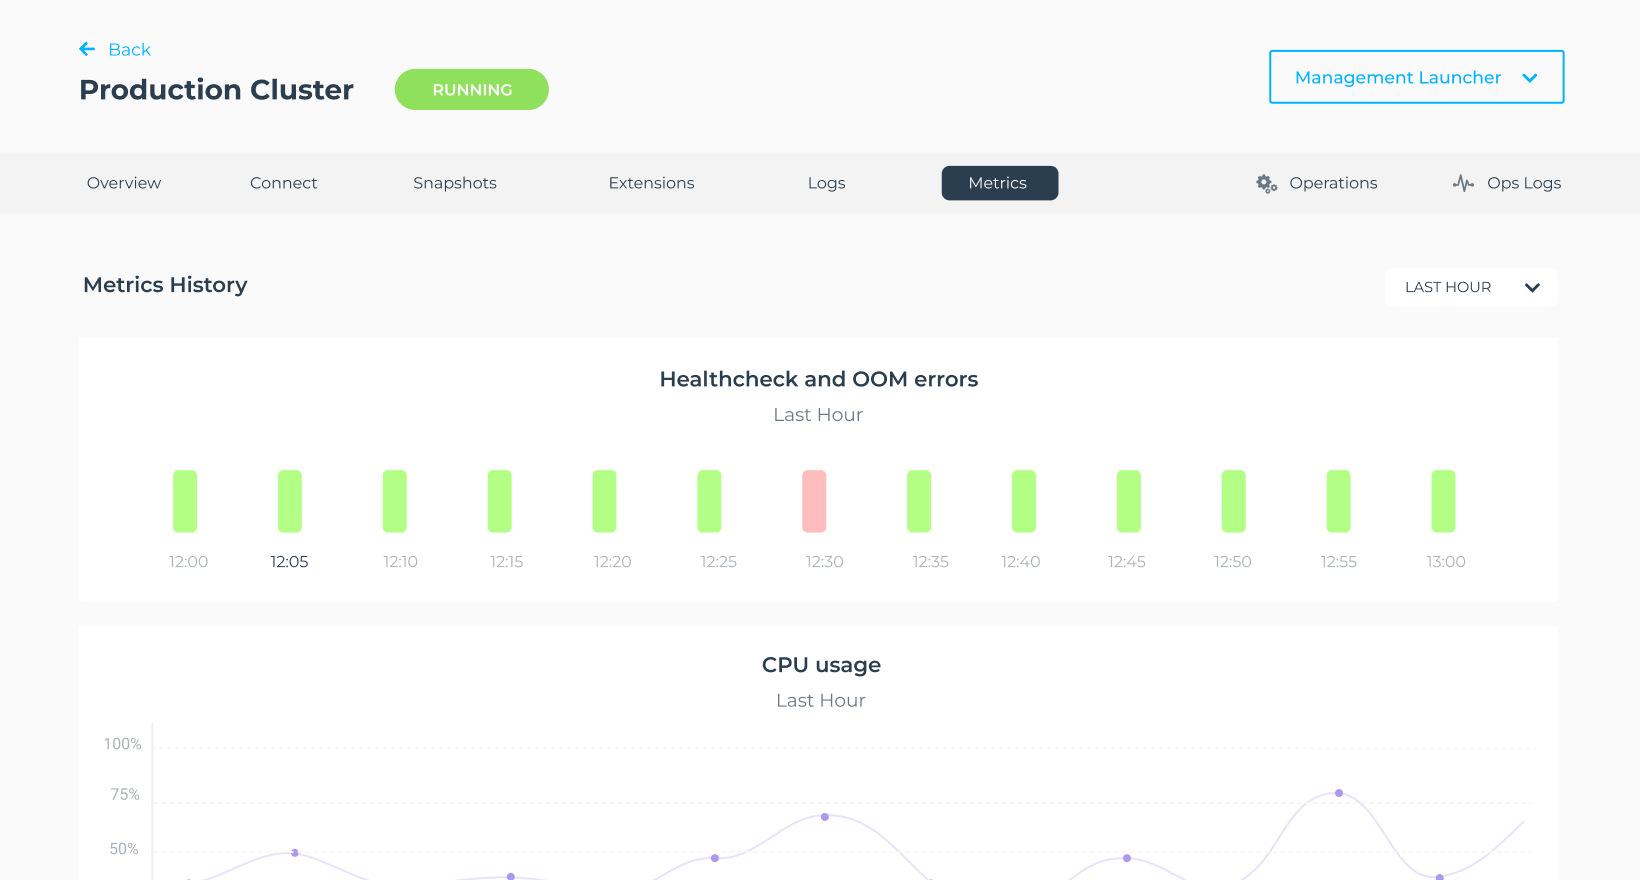
GrapheneDB offers historic metrics of the database and the underlying server, such as healthchecks, OOM errors, CPU, memory, network and disk. Metrics are displayed in the Console as charts that you can consult anytime.
You can select the time window for the historic metrics from the last hour to the last month.
Metrics endpoint
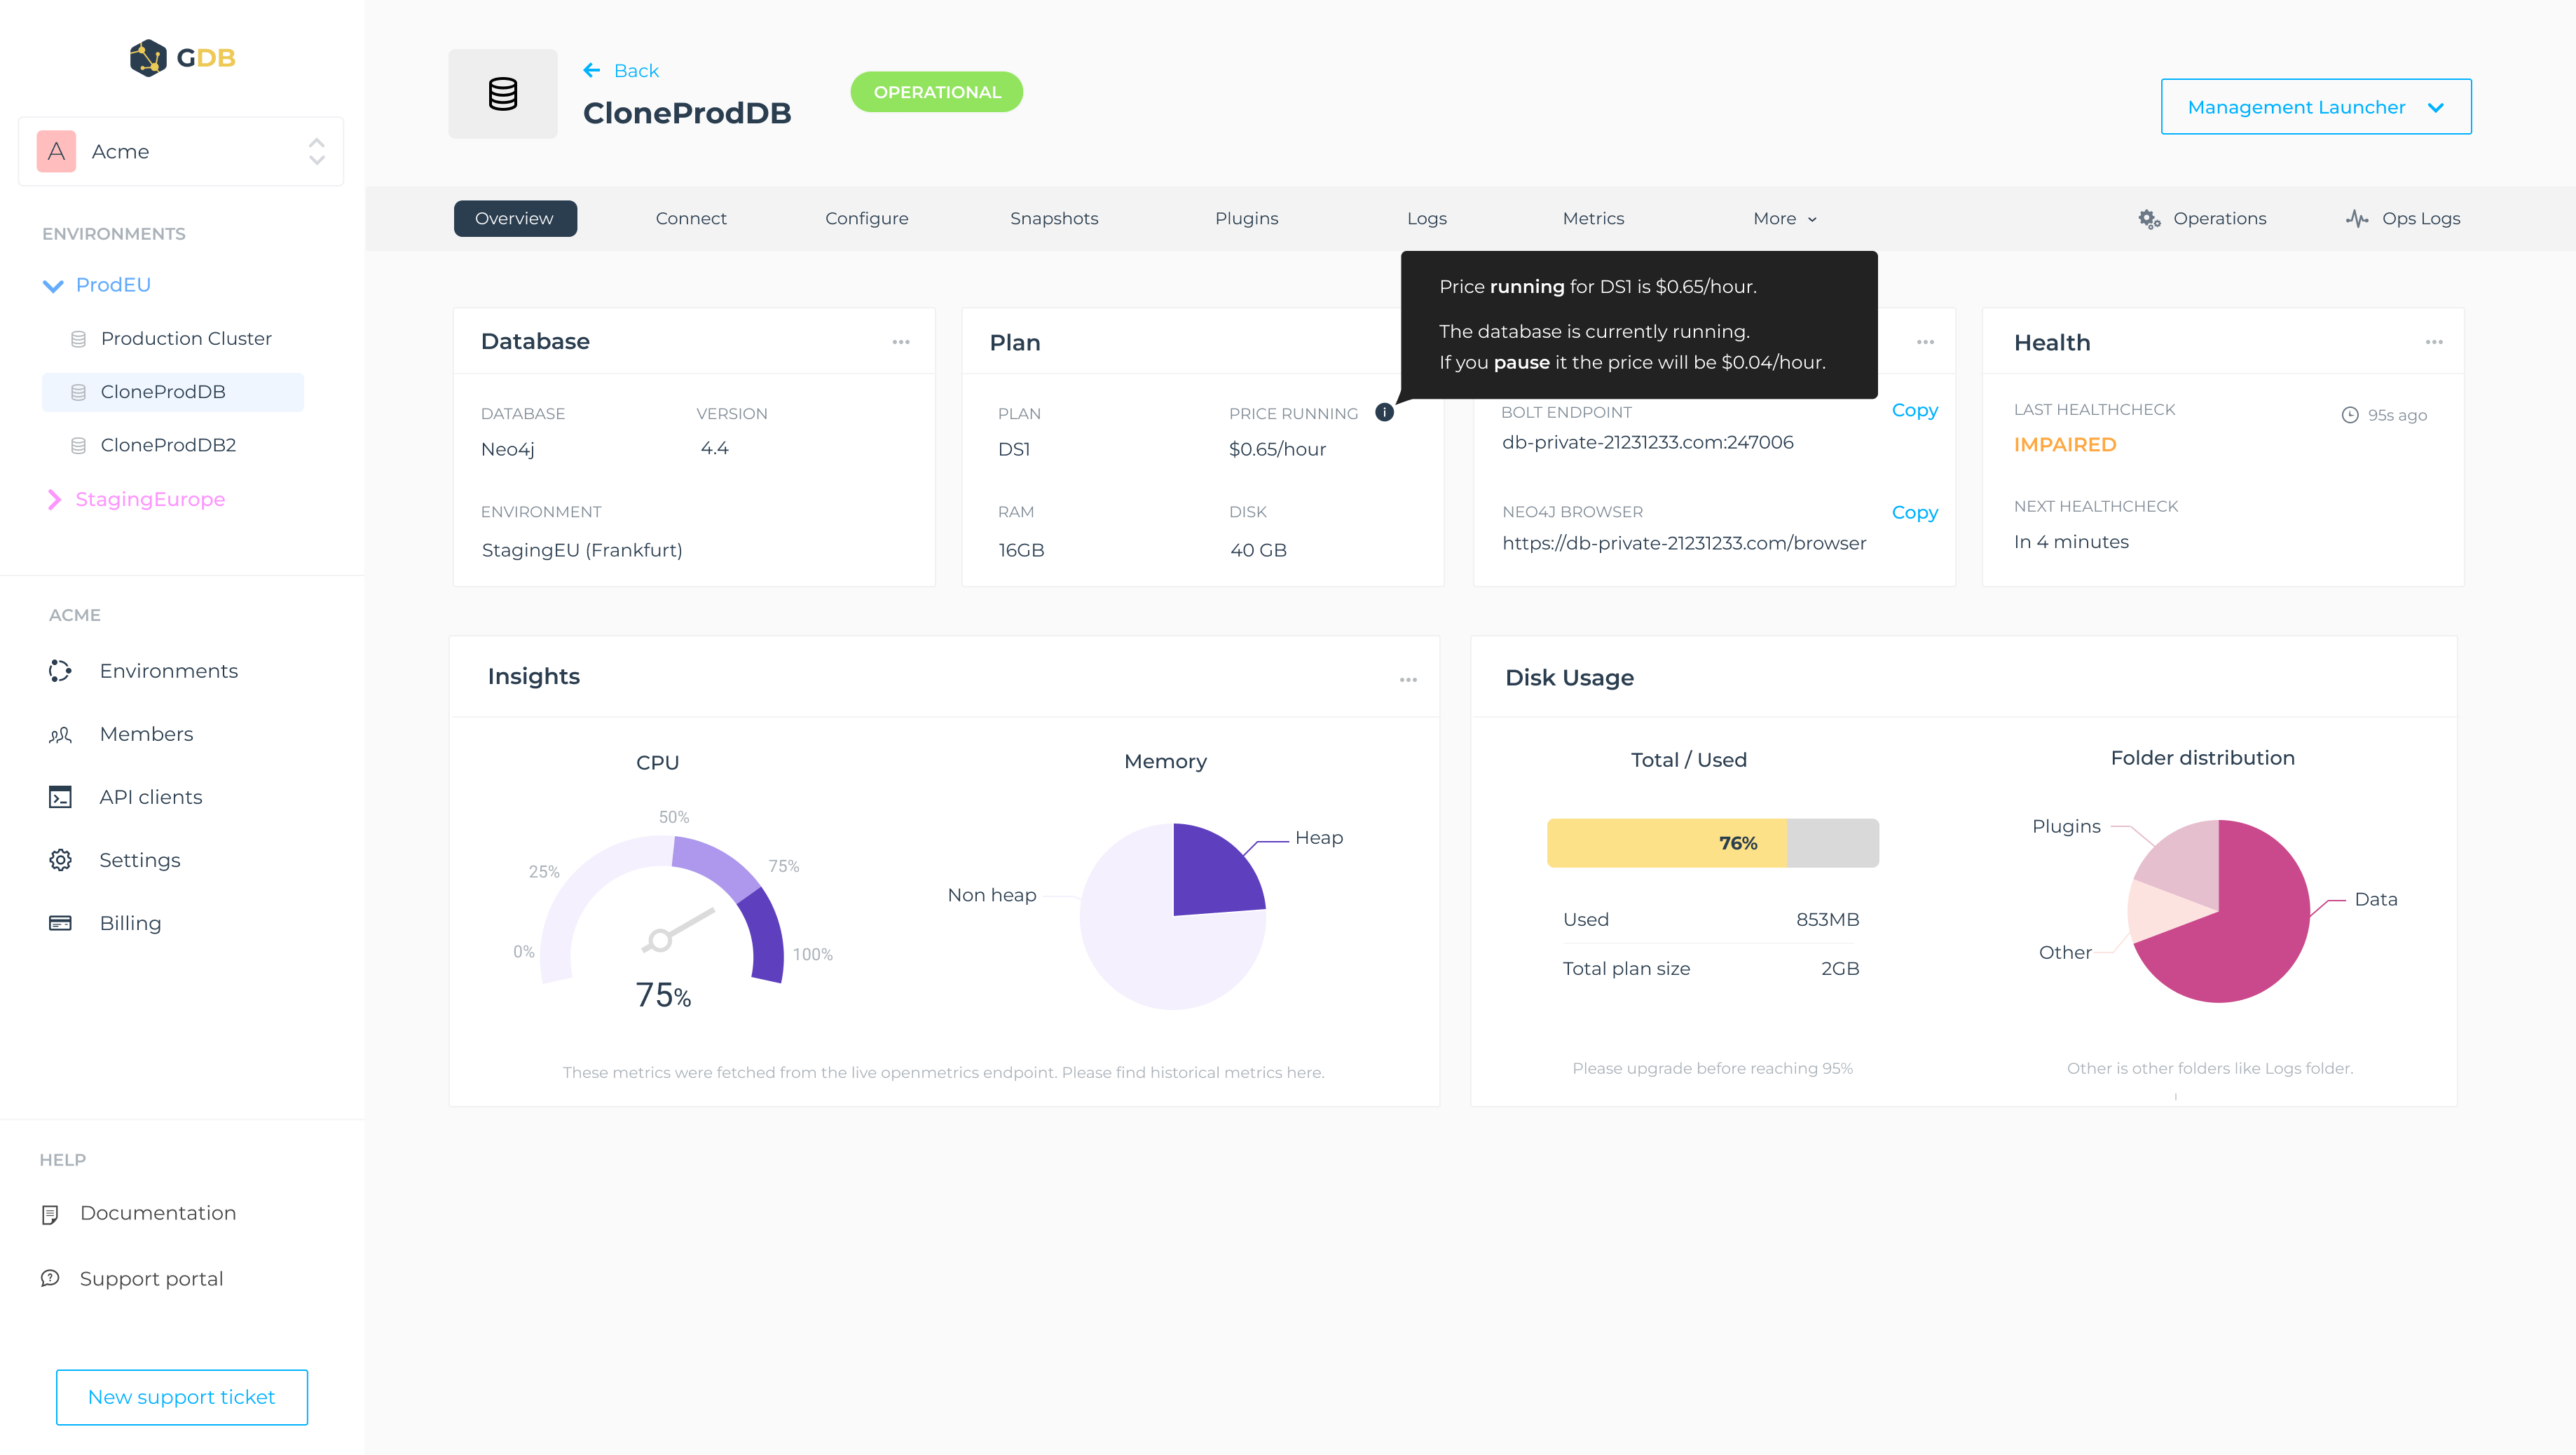
Additionally to the historic metrics that you can check directly from the Console you can use the metrics endpoint that every database offers.
This endpoint can be used as a target for your own Prometheus for scrapping database instance metrics or use it in other tools such as Datadog and create your own alerts.
Logs
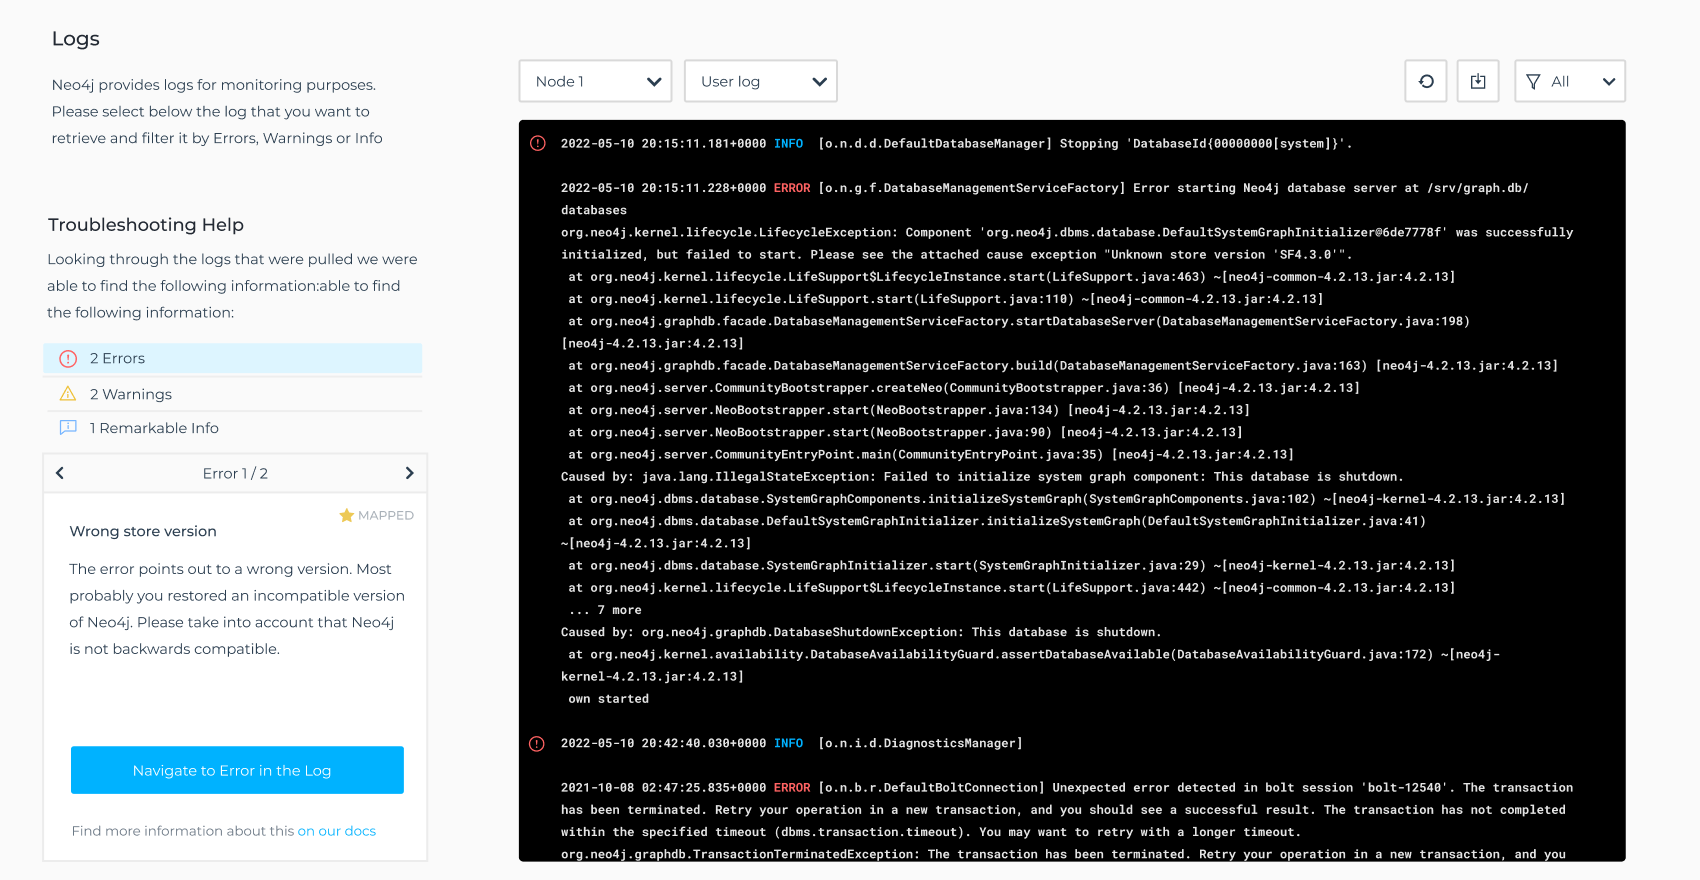
With GrapheneDB you can inspect the logs provided by your database for monitoring purposes.
Finding relevant information in Logs can be tedious, that is why we've added some extra functionality to find specif information quicker, for example by collecting Errors and Warnings or by showing extra information around log entries that you encounter often.
Notifications
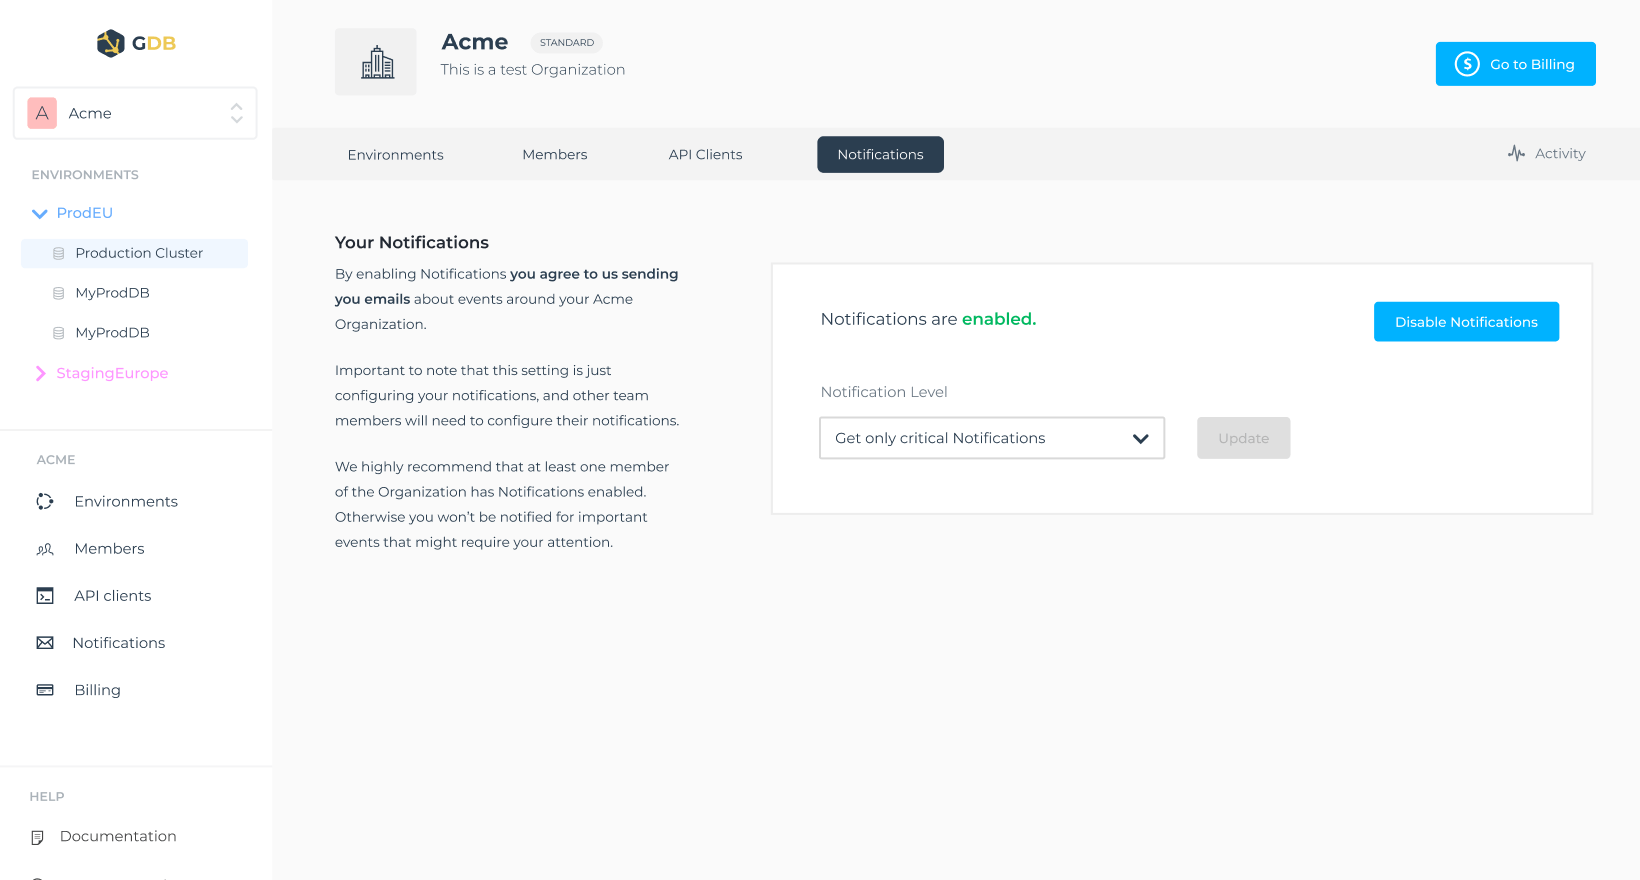
You can opt-in to receive email notifications from your Organization.
Notifications are very interesting if you want to be kept in the loop around events that occurred within the Organization.
You can choose just to be notified for critical events, like for example an important maintenance or for every event.
Non-critical notifications are for instance heads up notices in case operations finish successfully.
Activity feed
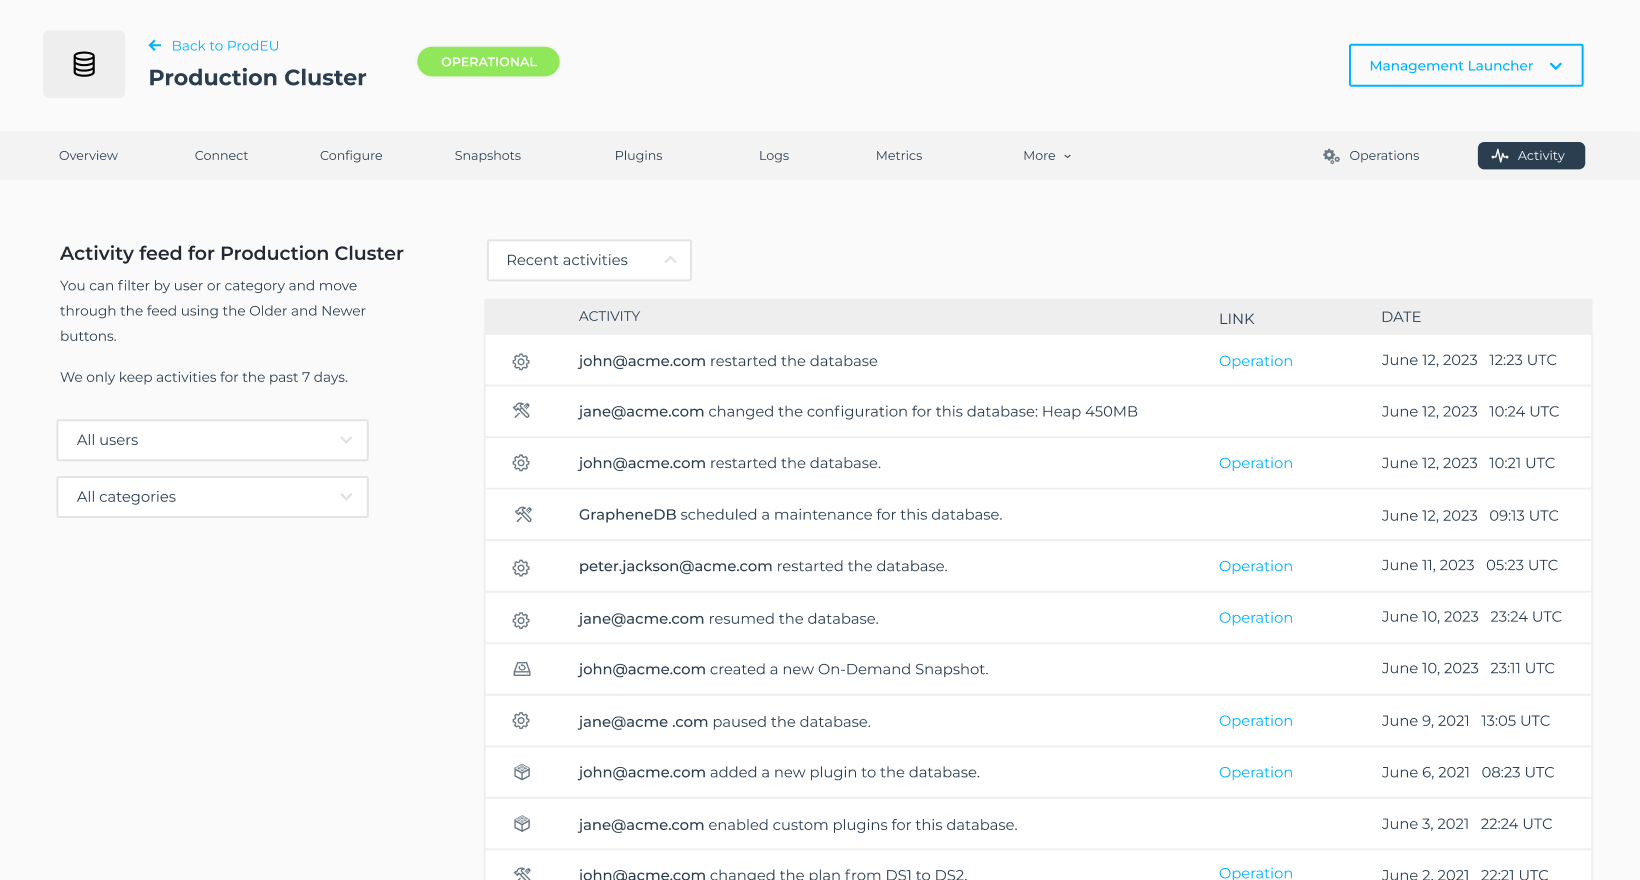
For every Database and Environment there is an Activity feed that displays selected events for your team, such as information on Operations or changes in configuration.
Activity feeds will allow you to know who did what. Every Activity feed offers filter options by team member and by category for easily retrieving the information that you're looking for.
Your Organization has also an Activity feed, in which you will find relevant events around your Organization, like credit card updates, credits, etc.
Cost visibility
When using pay as you go services it's crucial to understand costs and usage.
That's why we've built tools to provide visibility around costs and usage that you can explore anytime from our Console.
Every invoice has a breakdown of usage with granular detail. Additionally you can check your current usage of Metered Services of your Organization.
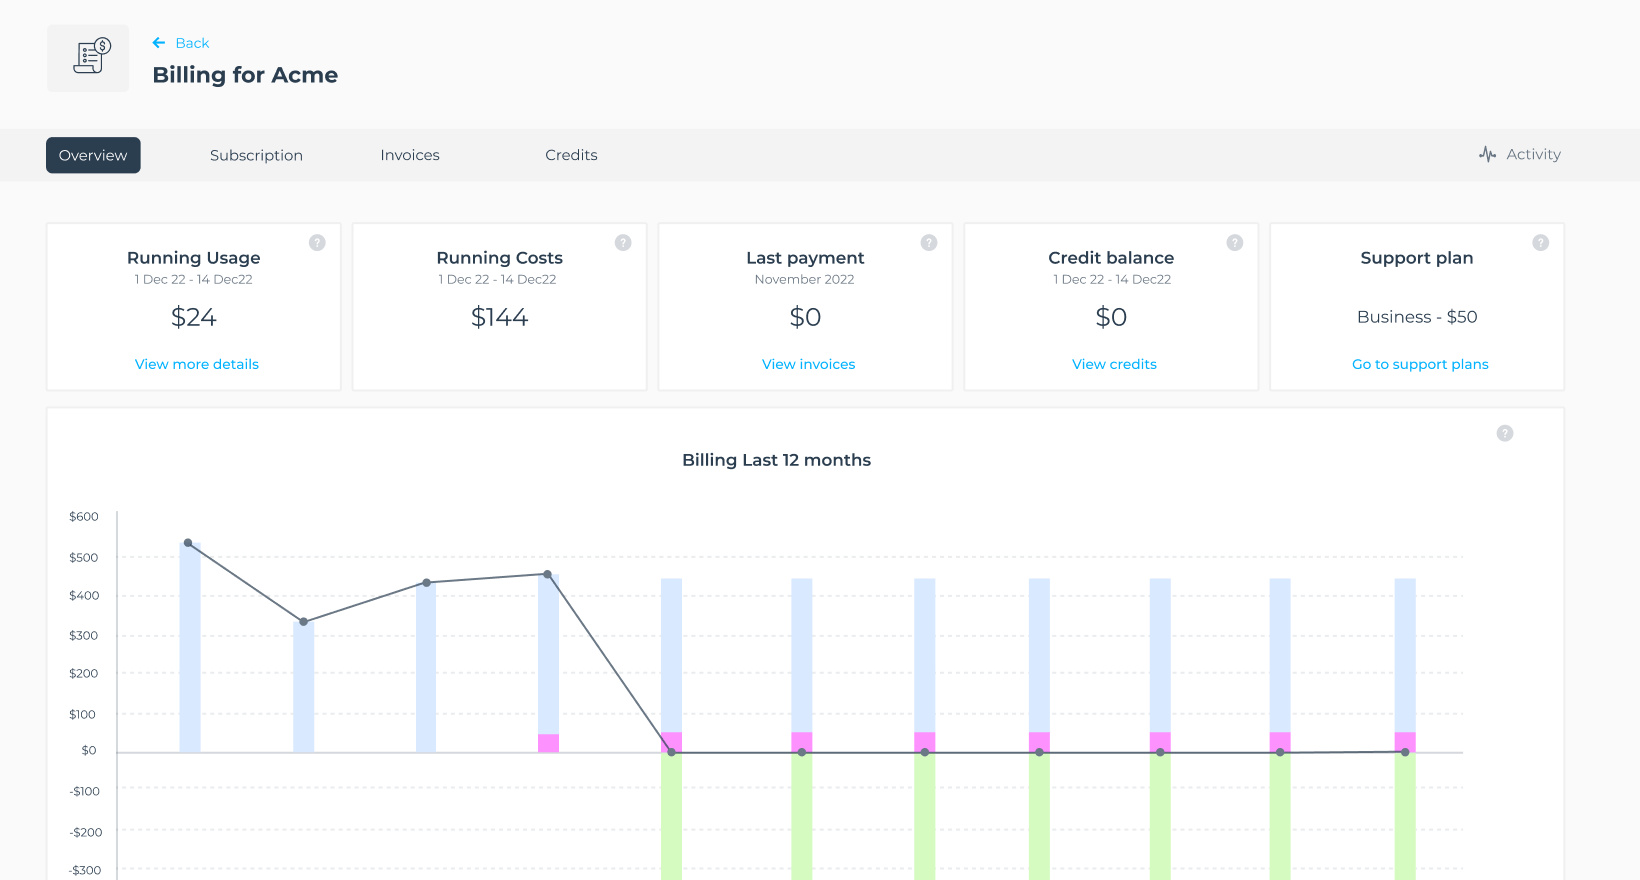
Furthermore, there is a Billing Dashboard with the most important billing metrics in which you will also find a history chart of your billing for the past year.
